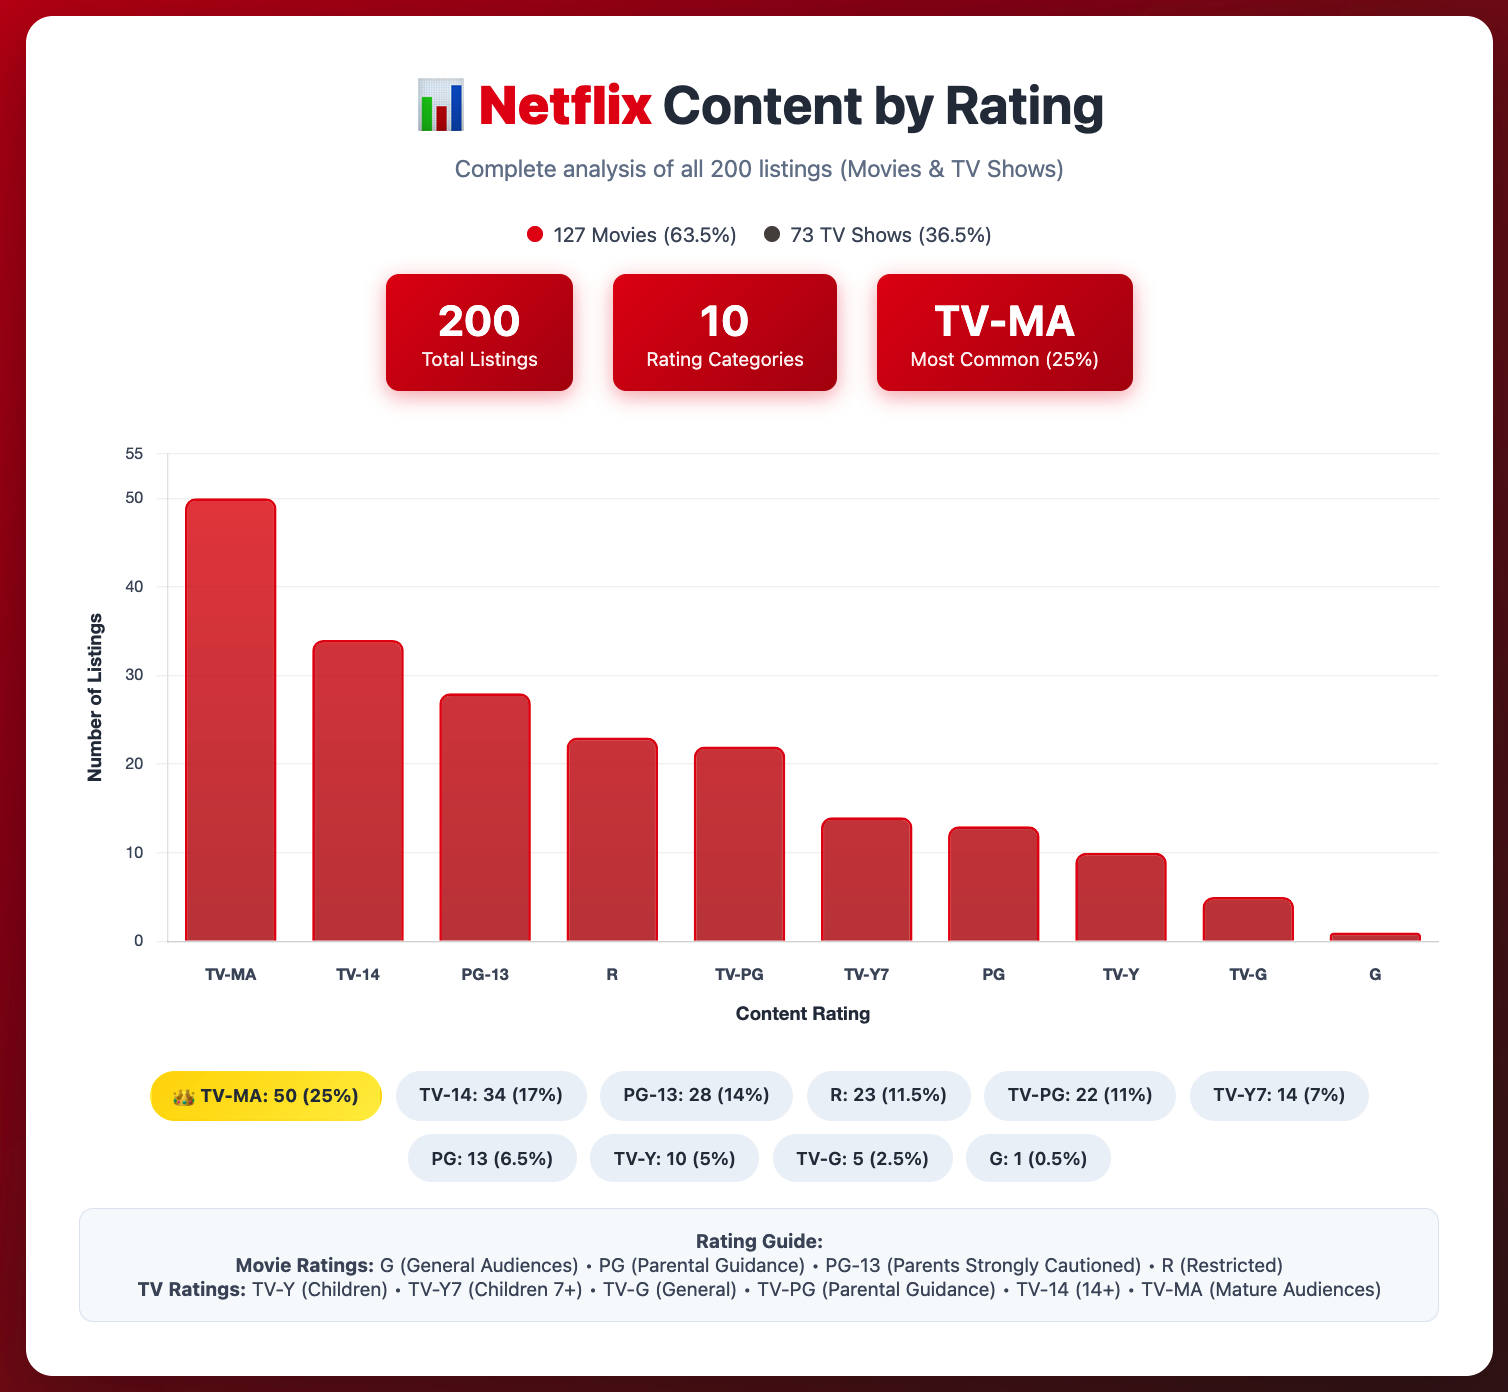
Claude.AI has enabled me to create data charts faster than any other tool I’ve used. The chart below was created in record speed, with this simple prompt:
See this chart live on Claude.AI.Analyze the attached file, Netflix.csv. Create a publicly shareable chart of movie counts by rating. The rating column contains the valid rating types.
Claude.AI not only does the hard analysis work faster than you can create charts in Excel or Power BI, but it also creates code you can add to any website to display the results. That means no infrastructure or subscriptions (i.e. Power BI) are necessary for simple charts.
See the same chart as HTML loaded onto my websiteSource Data
Netflix.csv